Browse
Browse is a view that organizes everything saved on the Datagrok server (files, queries, dashboards, spaces, and so on) in a tree. From here, you can find, preview, open, and manage anything in Datagrok. To open Browse, click the Browse () icon on the Sidebar.
Work in progress that isn't saved to the server yet doesn't appear in Browse. It lives in the Dashboards panel on the Sidebar. See Unsaved work.
Browse tree
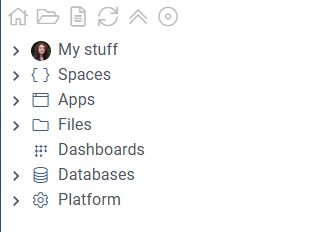
The tree has seven top-level nodes, in this order:
- My stuff: Your personal directory. It starts with Recent, Favorites, and Shared with me, followed by folders for the entities you own, grouped by type: My connections, My dashboards, My scripts, My tables, and others. Everything you create is saved here unless you save it to a space.
- Spaces: Team spaces, where entities are organized by project, department, or any other structure your organization chooses. A space can hold dashboards, queries, files, and child spaces, and its permissions apply to everything in it. To learn more, see Spaces.
- Apps: Applications from installed plugins, such as Tutorials and the demo app.
- Files: File shares and their folders and files.
- Dashboards: Dashboards you can access.
- Databases: Database connections grouped by database type, with their queries and, where the connector supports it, schemas, tables, and columns.
- Platform: Galleries for platform-level entities such as plugins, functions (queries, scripts, OpenAPI), users and groups, layouts, notebooks, predictive models, and sticky meta types, along with administrative tools and settings. The node is always present, but what it contains depends on your privileges, and most users see only part of it.
Above the Browse tree, there is a Top Menu. From here, you can do the following:
- Open the Home page ()
- Open a file from your computer ()
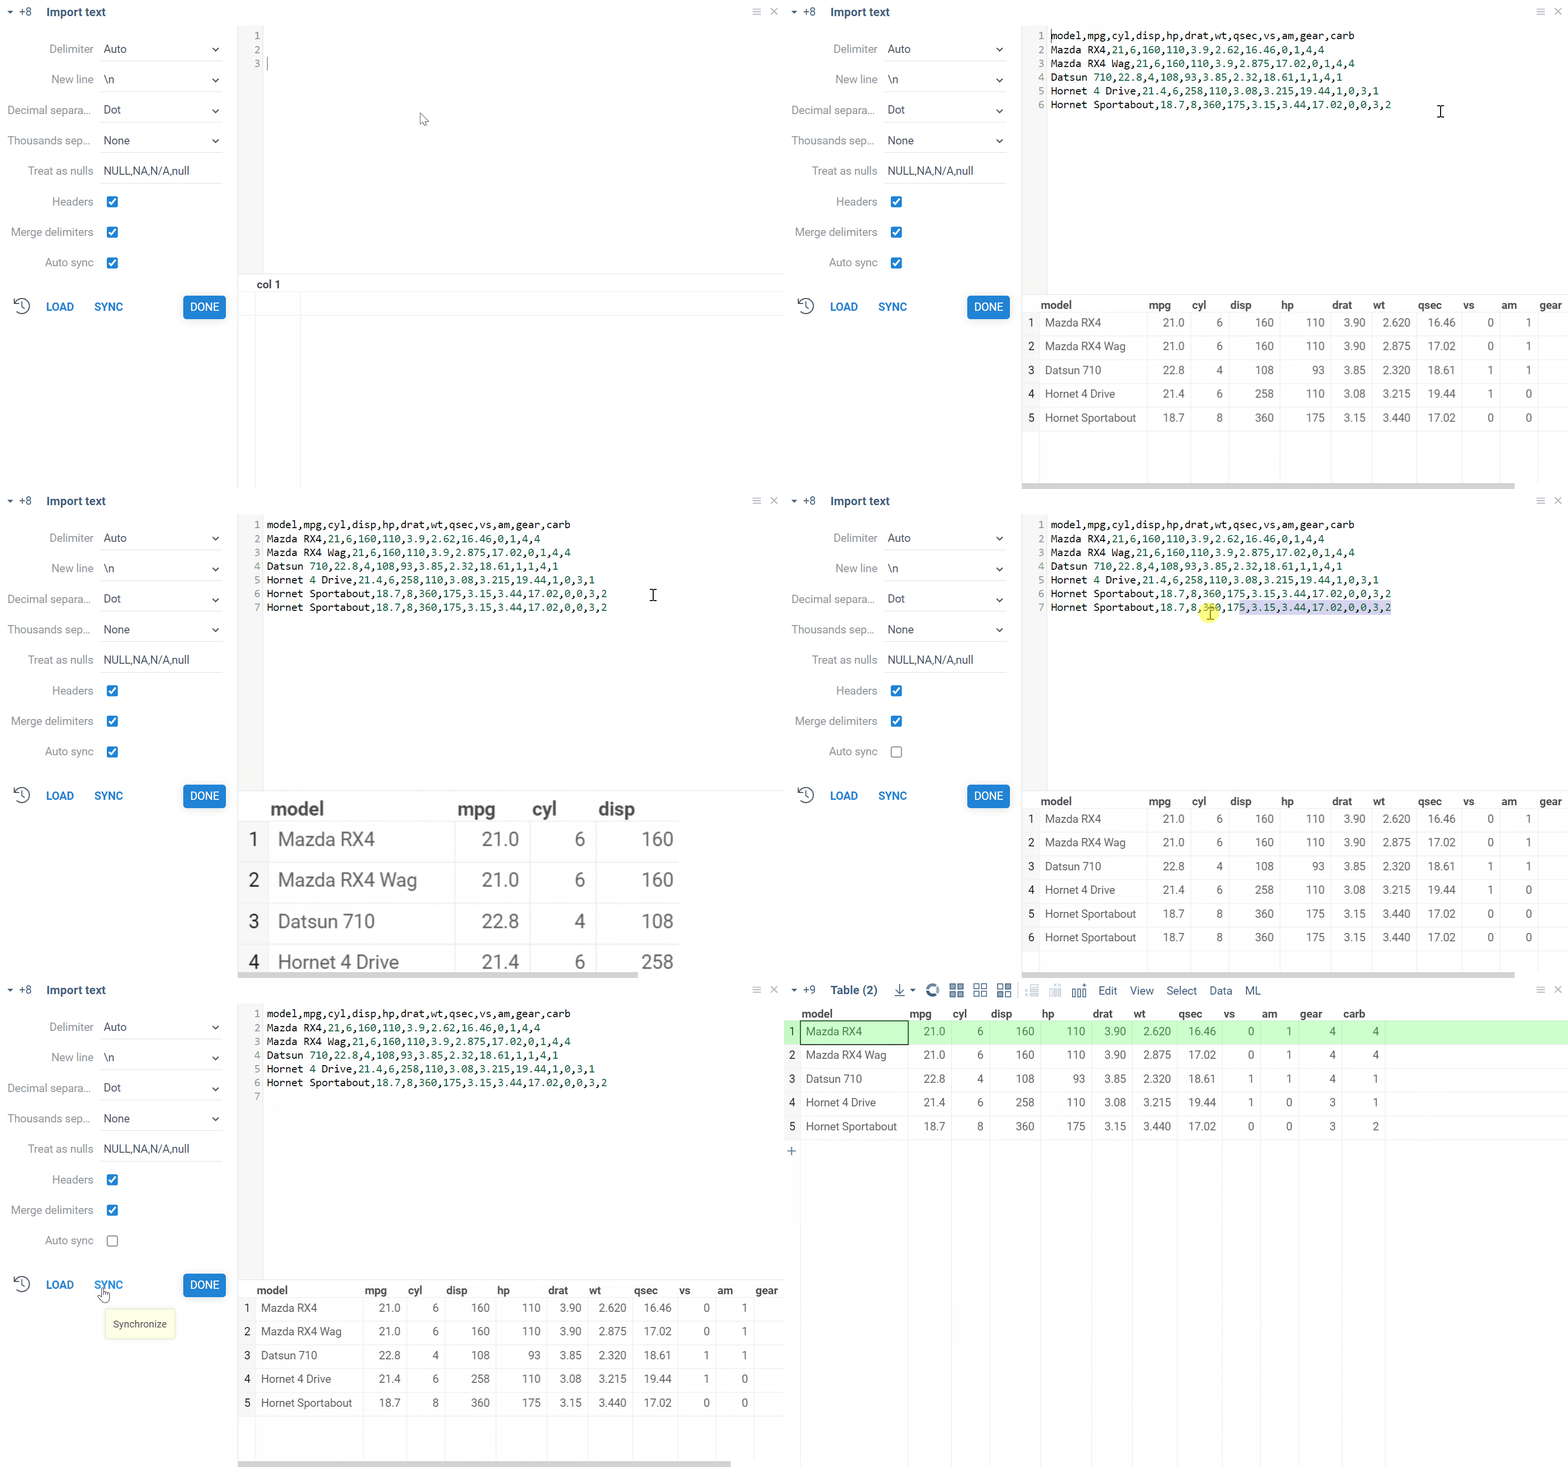
- Open the Import text view ()
- Refresh the tree from the server (). Entities saved or shared after the tree was loaded appear only after a refresh
- Collapse all expanded nodes ()
- Find the entity that is currently open and select it in the tree ()
Controls
Within the Browse tree:
- Click an object to open its view and update the Context Panel and Context Help with entity-specific information.
- Double-click an object to open it in the workspace.
- Right-click an object to access its context commands, such as Share..., Rename..., or Delete...
Use the up and down (↑↓) keys to navigate and the left and right (←→) keys to expand or collapse a node.
Managing entities
To share, rename, delete, or perform other common actions, use the entity's context menu (available on right-click).
Gallery nodes such as Dashboards or Layouts have no context menu. Open the gallery and use the commands on the items inside it.
To move entities between directories, drag them in the tree. You can drag any entity to My stuff or into a space, and a space to the Spaces node to make it a root space. When you drop an entity into a space, Datagrok asks whether to Move or Link it, and, for entities that are already on the server, also whether to Clone it.
Moving an entity between spaces changes its hierarchy, its name, and its privileges. To learn more, see Moving entities between spaces.
Entity views
Similar to a file explorer, clicking an entity in the Browse tree opens an entity-specific view alongside it. These views vary depending on what you click. For example, clicking a file shows its contents, while clicking an entity gallery like Layouts shows all entities of that type.
Here are a few examples.
- Files
- Databases
- Apps
- Dashboards
- Entity galleries
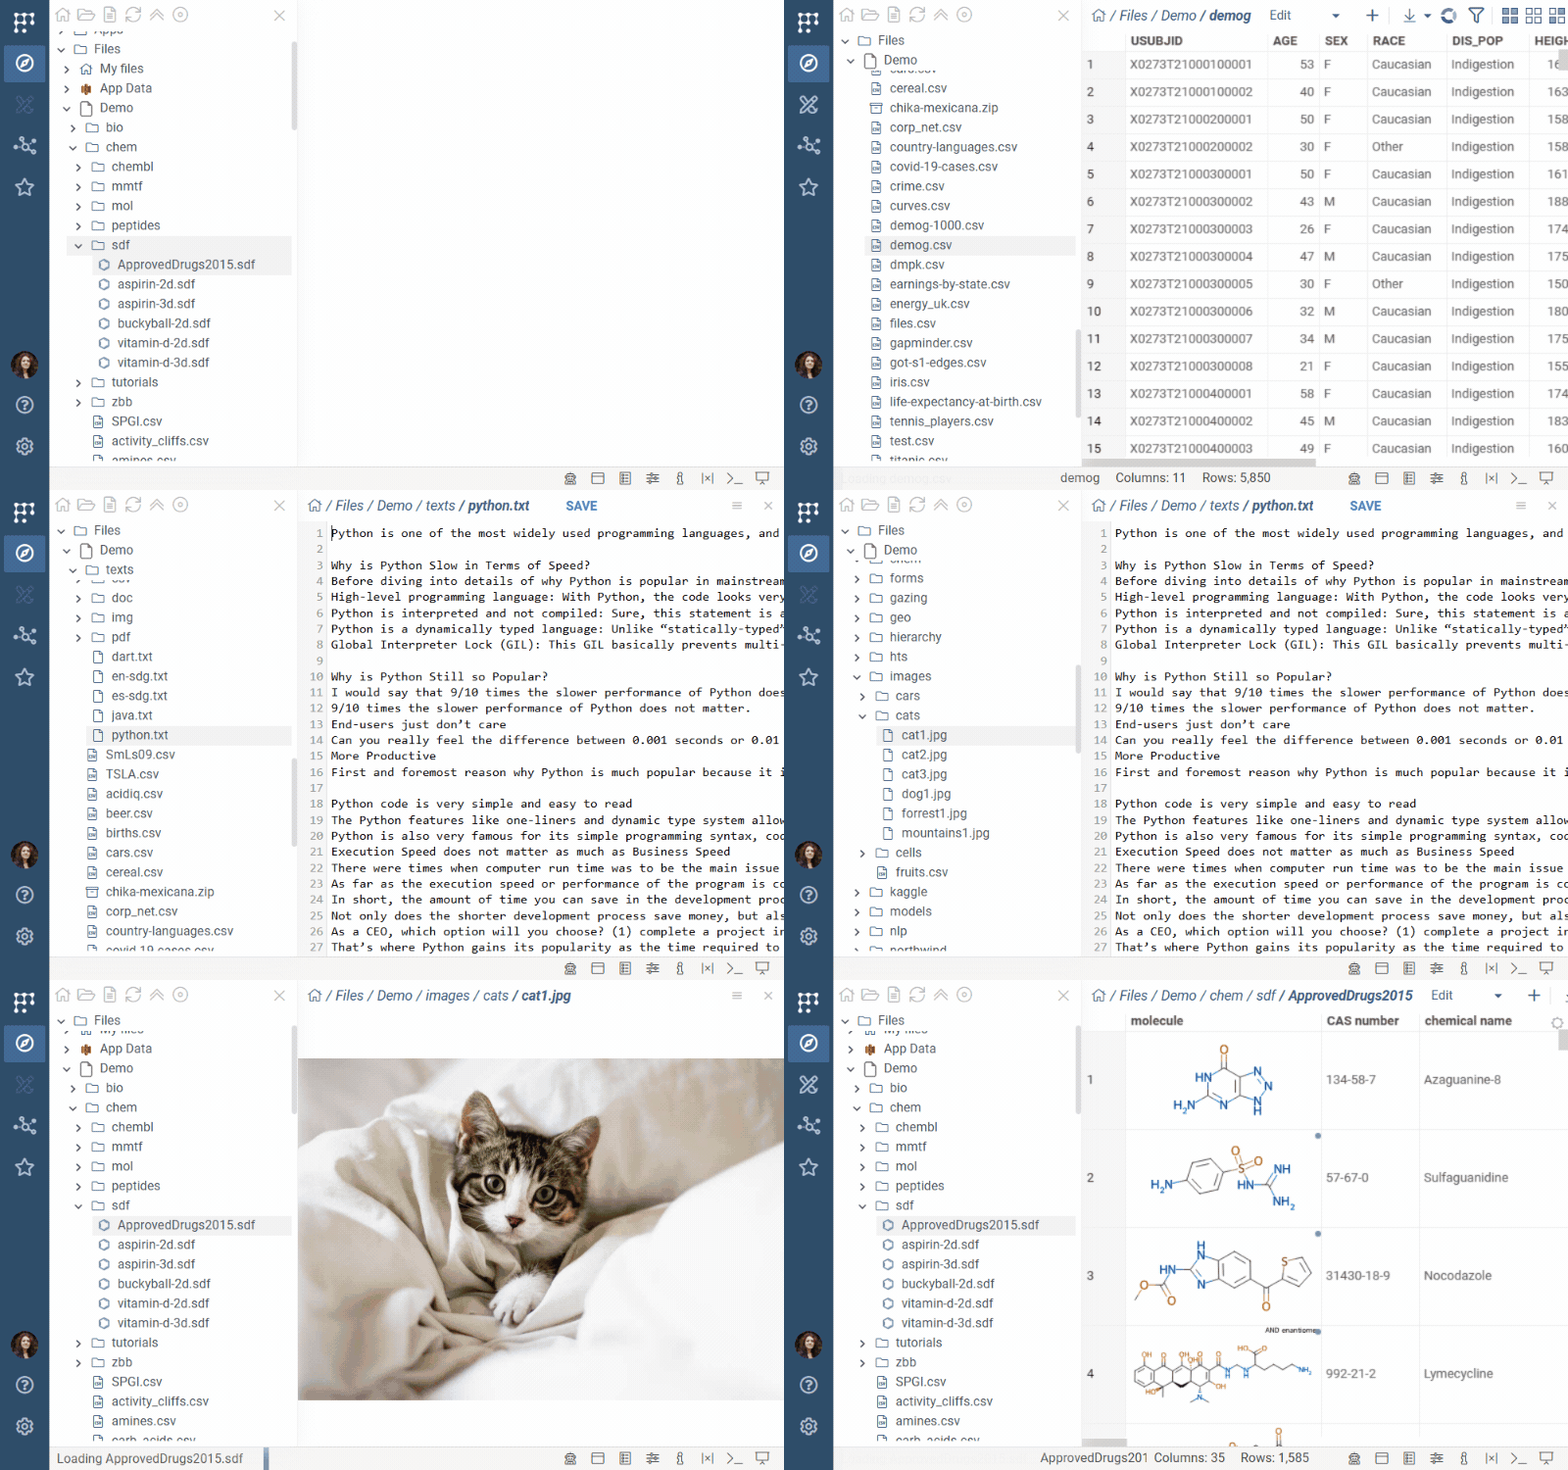
When clicking a file, what you see depends on the file's format and the data inside it. For example:
- Clicking a spreadsheet file visualizes its data using an interactive spreadsheet viewer.
- Clicking an image file shows the image.
- Clicking a file with molecules or proteins visualizes them using cell renderers and interactive viewers.
- Clicking text-based files like Markdown, TXT, and HTML opens a text editor.
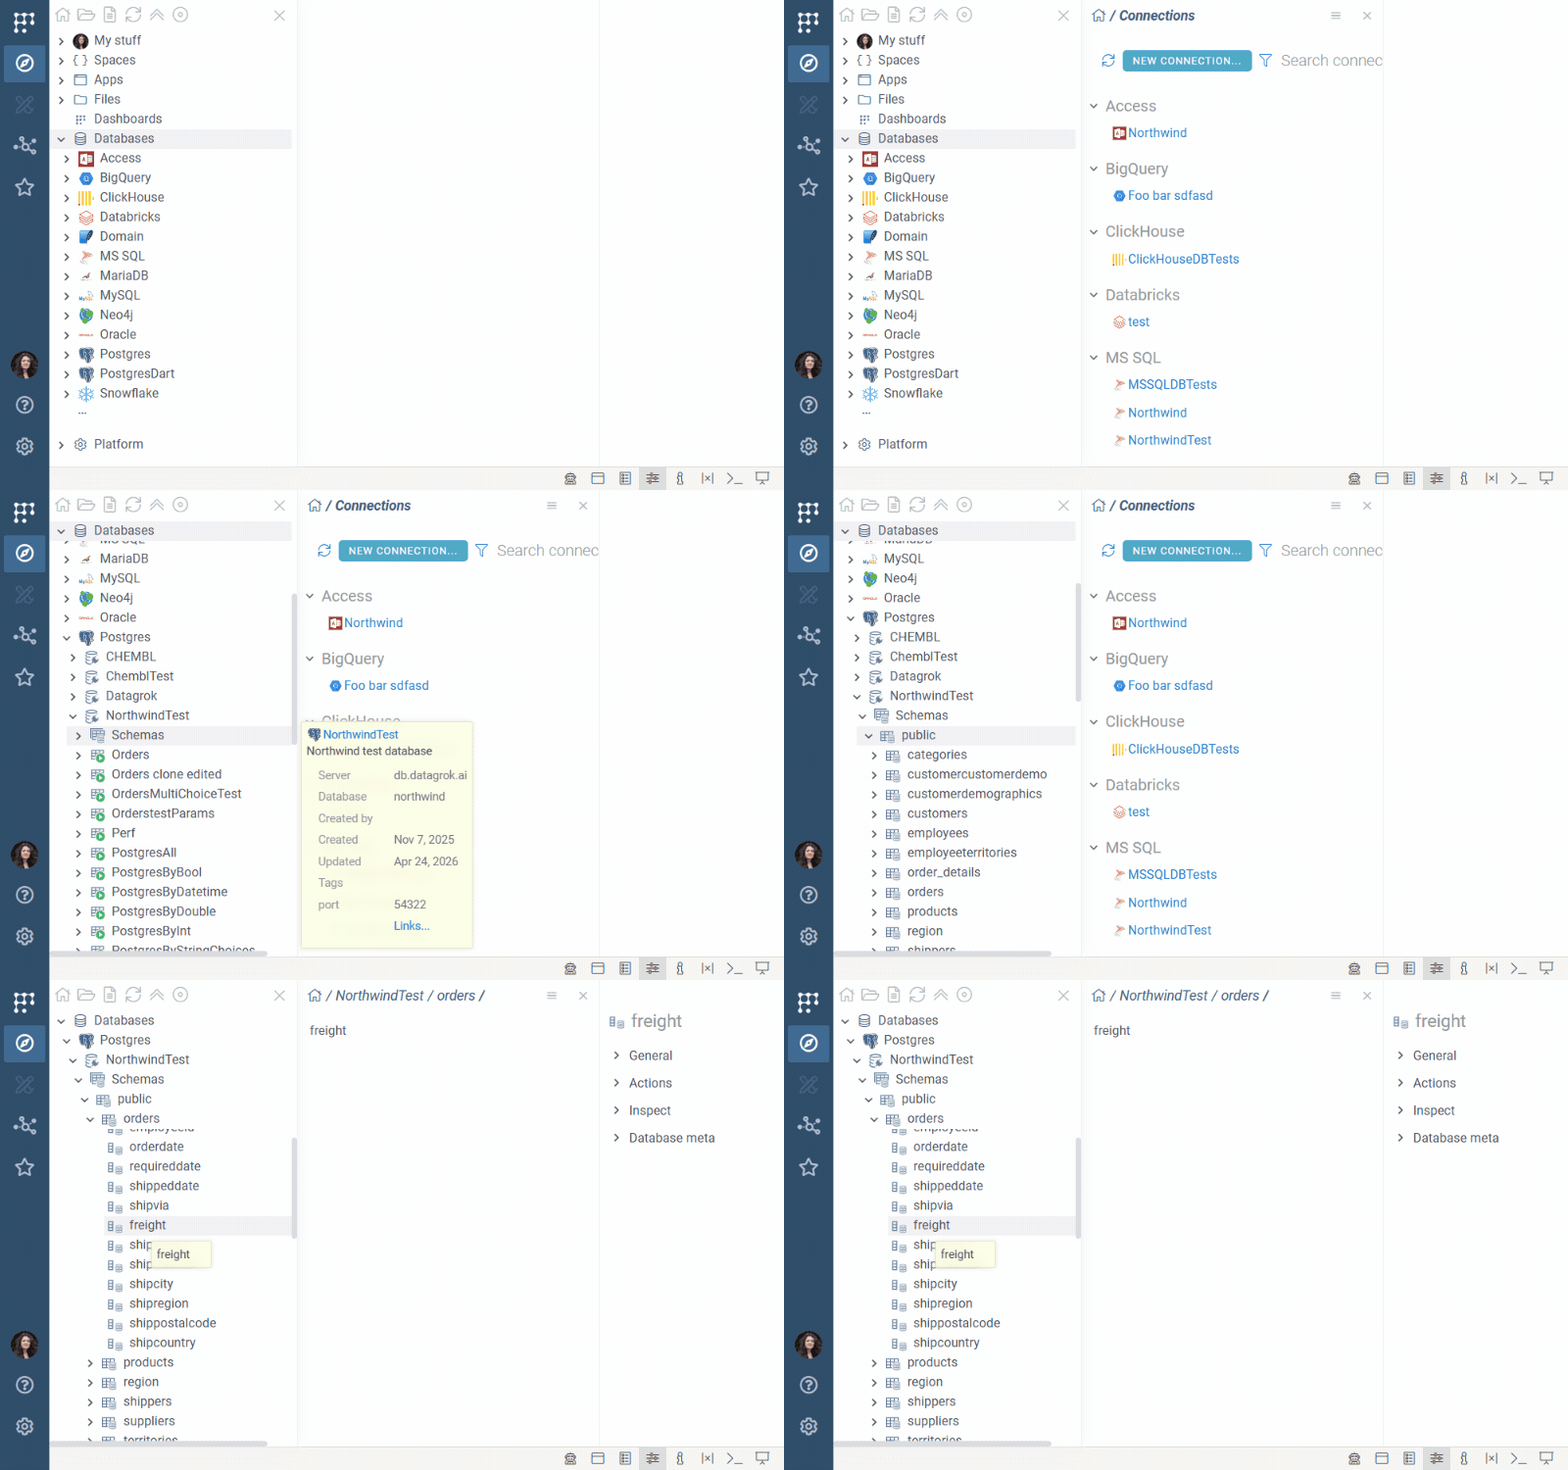
Using Browse, you can explore relational databases by viewing their schemas, tables, column info, and query results.
Clicking an app opens an app-specific view: a landing view, a README, or a package card with a RUN button. Administrative apps such as Usage Analysis or Test Manager live under Platform > Admin rather than under Apps.

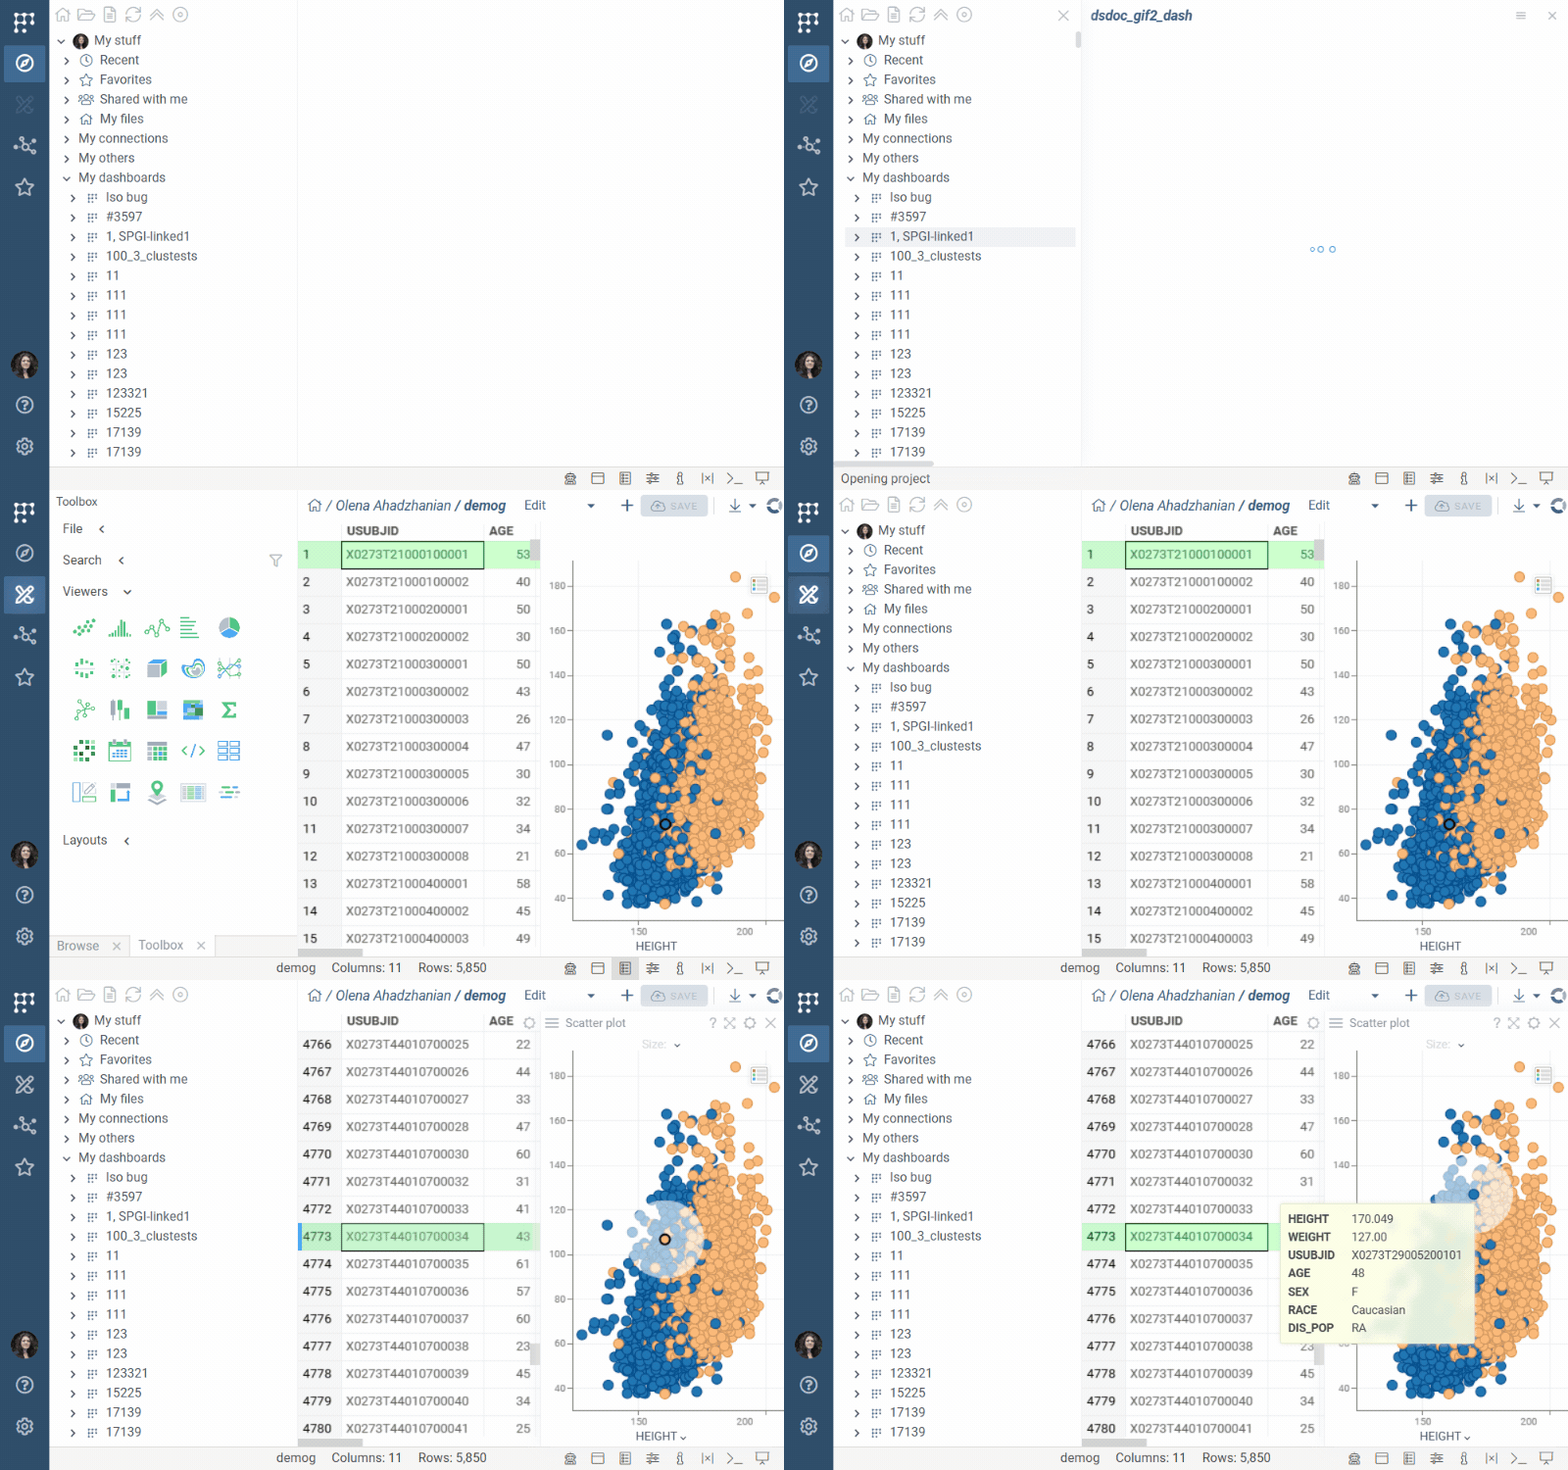
Clicking a directory that contains entities of the same type (like queries or layouts) opens a Gallery view. Its toolbar has a NEW button for creating an entity of that type, a Toggle filters command that opens filters by author, date, and tags, the search bar, three display modes (cards, table, list) and a Sort list command.
The search bar filters the list as you type. You can search by name, by tag, or by properties, and combine conditions with AND and OR. For the syntax and examples, see Entity search.
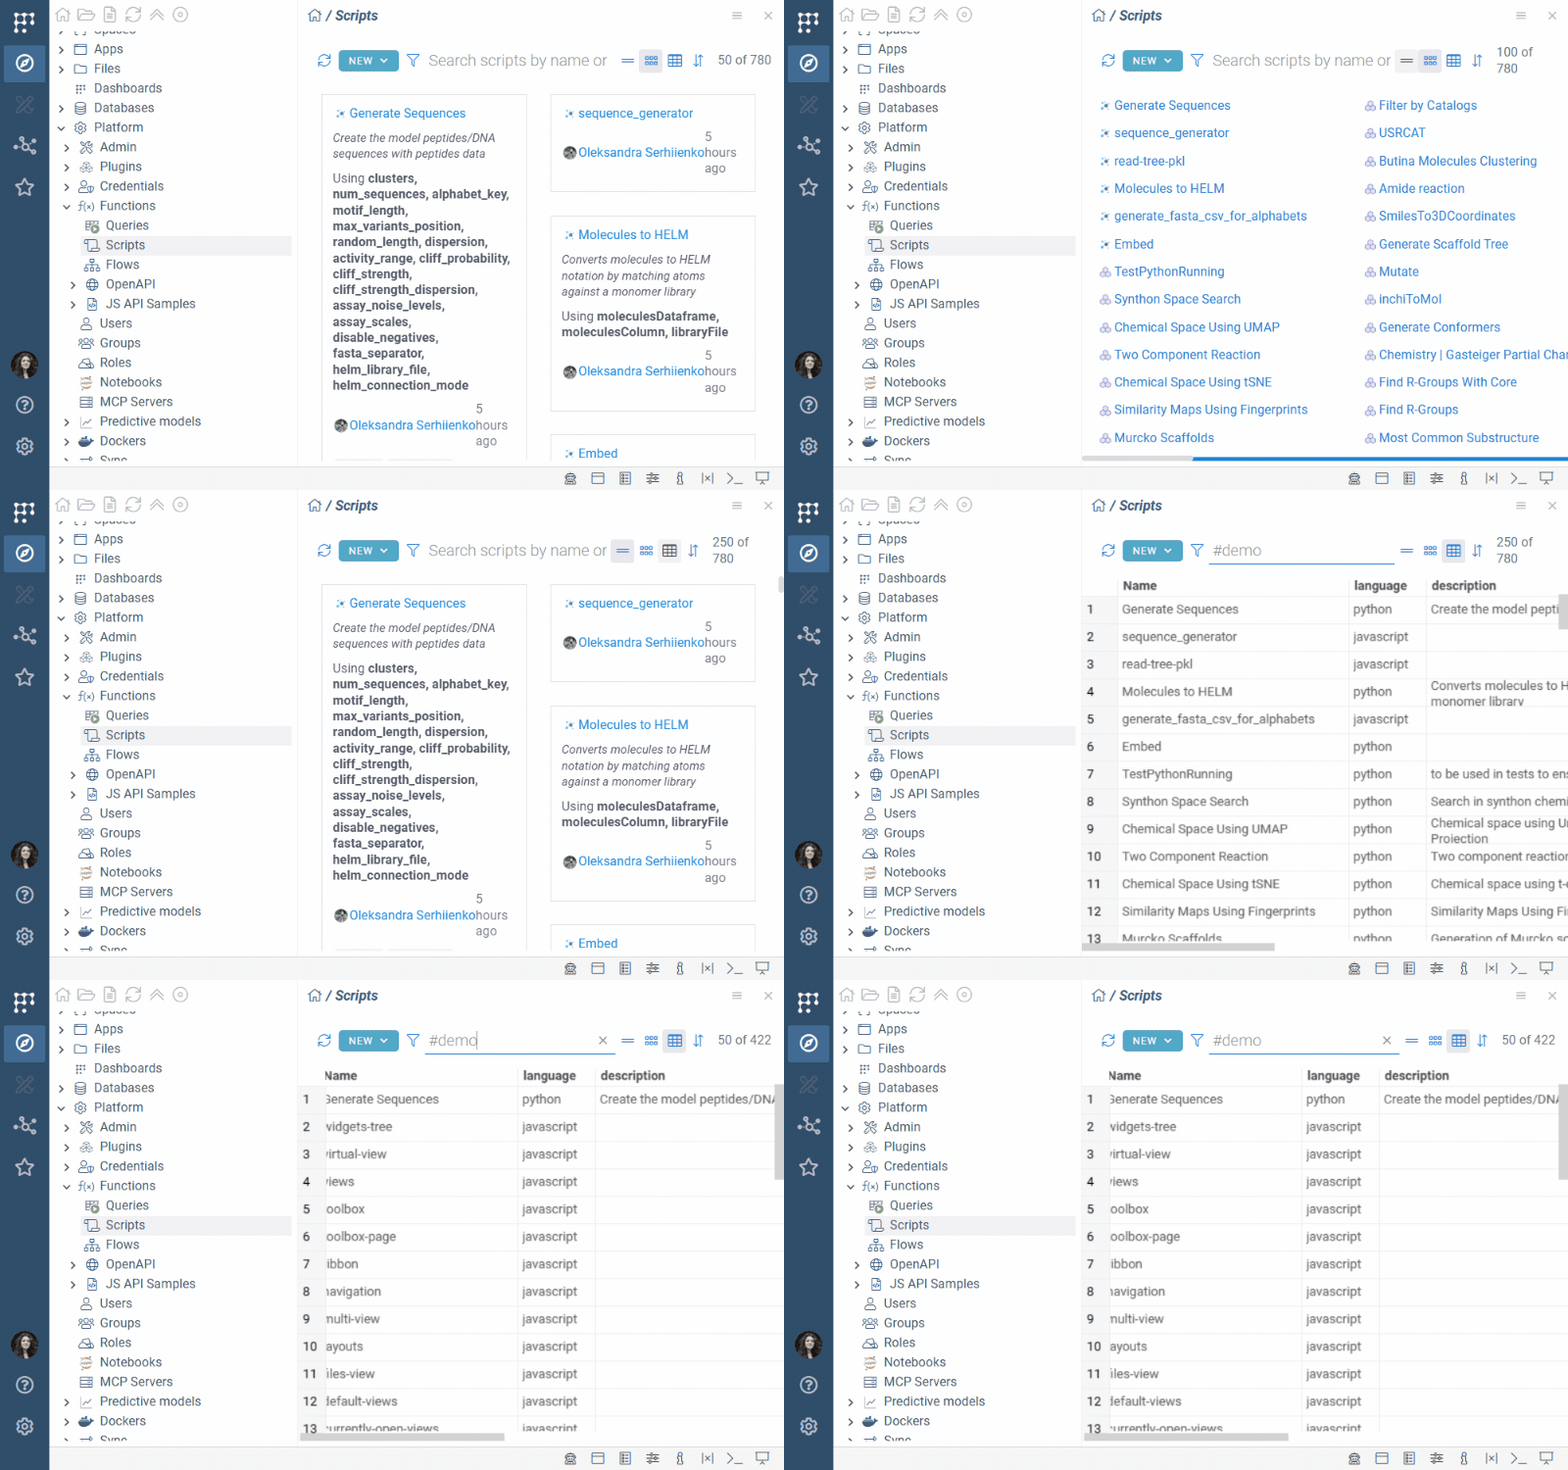
Like other views, entity views are fully interactive and support drag-and-drop and docking. To learn more about the Datagrok UI, see User interface.
Unsaved work
Everything you open or create lives in your browser until you save it. Open tables, views, and the dashboard they belong to are listed in the Dashboards panel on the Sidebar. A table you just opened, for example from a local CSV file, appears there under New Dashboard, a dashboard that doesn't exist on the server yet. Open tables are also listed in the Tables panel.
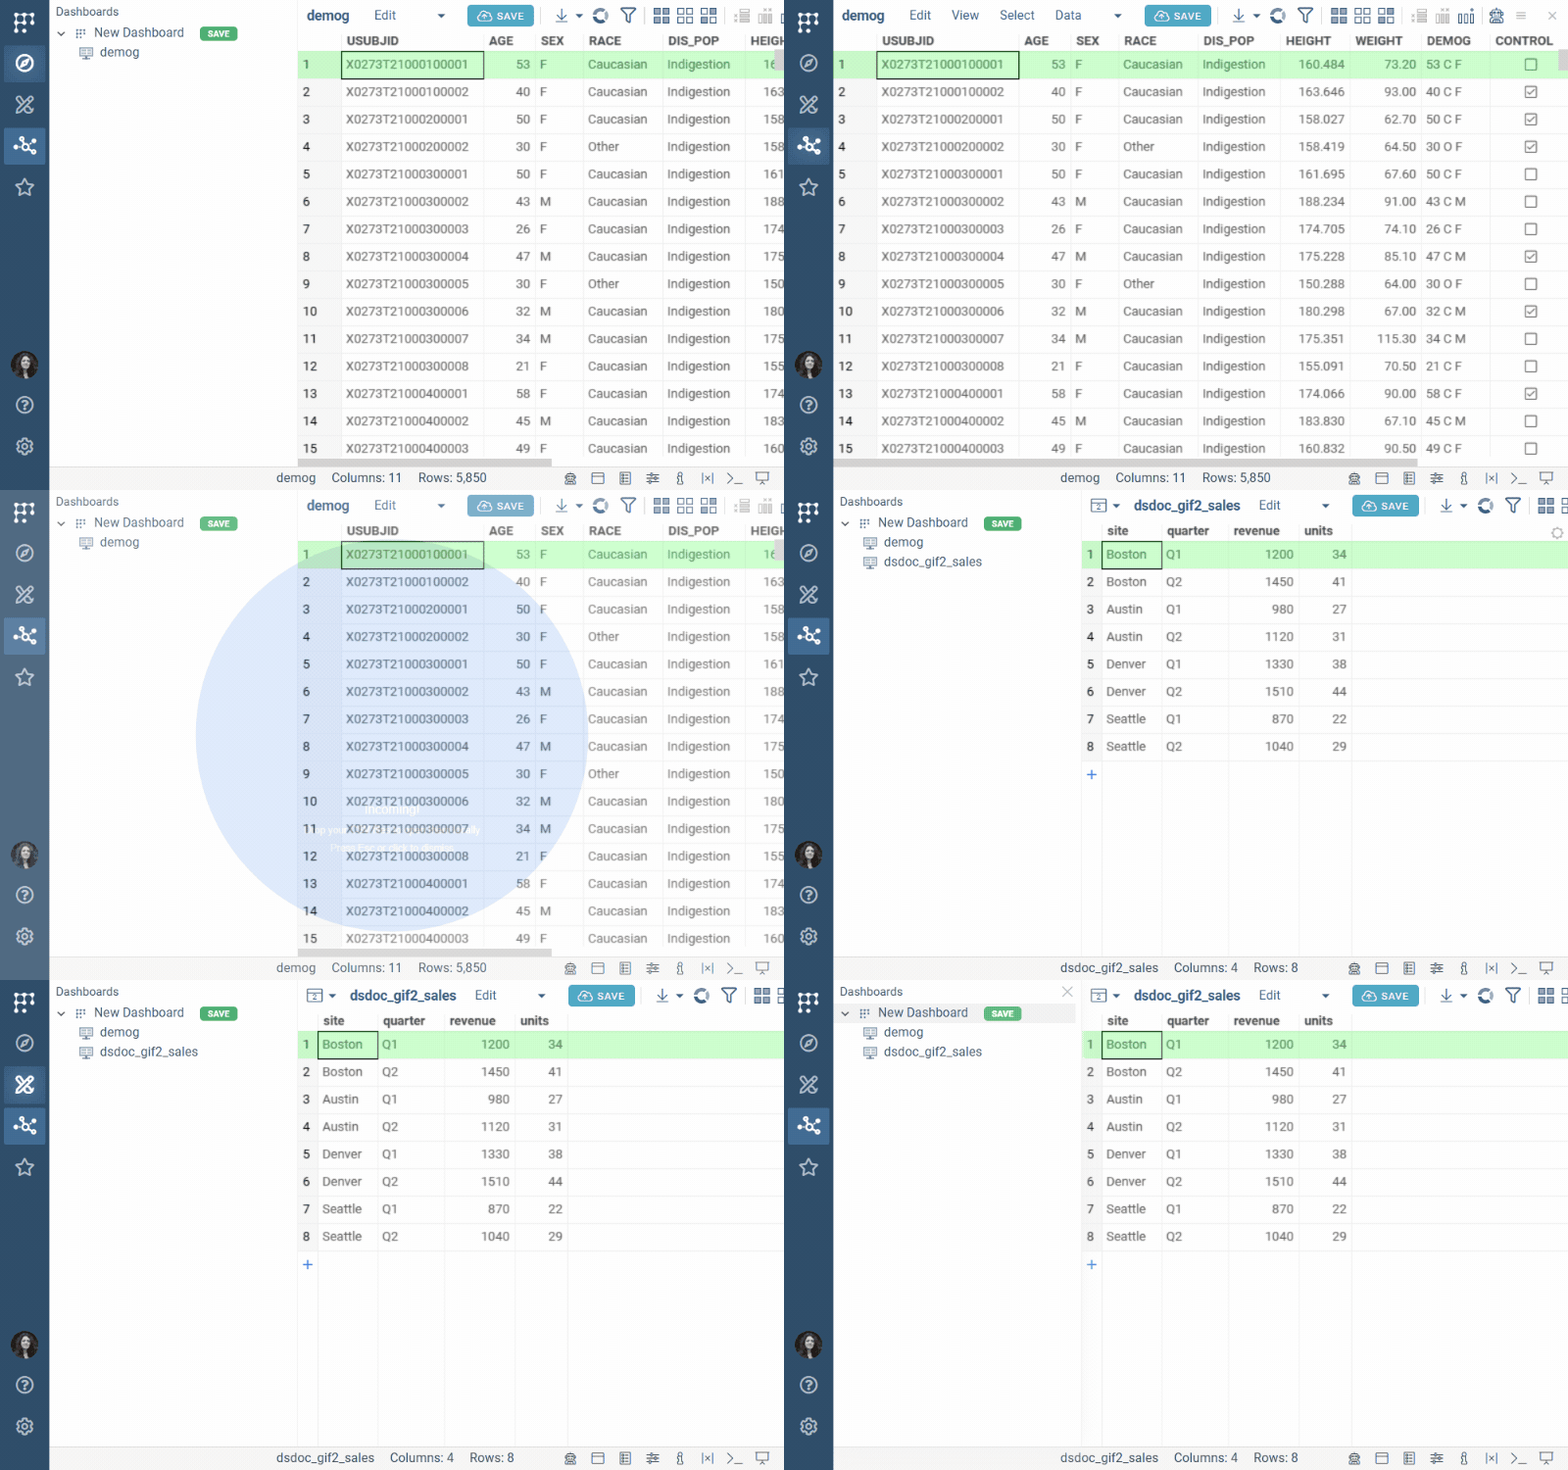
If you close or refresh the browser tab with unsaved work, the work is lost.
Saving
To save, click the SAVE button in the Dashboards panel or at the top of the Table View. A new dashboard is saved to My stuff > My dashboards, and Datagrok opens the Share dialog right away, so you can share it or close the dialog to keep it to yourself.
For a dashboard that already exists on the server, the Save project dialog offers three choices: Save original project, Save a copy, and Save personal view customizations. After a save, the SAVE button turns grey to indicate that there are no unsaved changes. You can still click it to save a copy or personal customizations. To learn more, see Saving a dashboard.
Local copy and server copy
A dashboard you opened is a local copy, independent of the copy on the server. Changes you make locally reach the server only when you click SAVE, and changes made on the server reach the tree only when you click Refresh on the Top Menu.
This has two consequences:
- Saving a local copy with Save original project overwrites the tables and the layout on the server with what you have locally. Anything a colleague, or you in another browser tab, saved to the same dashboard in the meantime is lost, and Datagrok doesn't warn about it. The only thing that survives is the dashboard's name, which the server keeps. Before saving a shared dashboard that has been open for a while, reopen it from Browse or save it as a copy.
- If a table of an open dashboard is deleted on the server (for example, from the Browse tree), your local copy keeps the table, but the dashboard can't be saved anymore from that session: the save fails with a server error. Reopen the dashboard from Browse and add the table again.
Home page
When you first log in or click the Home () icon on the Top Menu, Browse shows the Home view. At the top, it has a search ribbon for searching anything within the platform, for example a compound name or a PDB ID. Below, it showswidgets like Spotlight or Usage. The widgets you see depend on the plugins installed. For example, the Spotlight widget is provided by the PowerPack package, and the Usage widget appears with the Usage Analysis package.
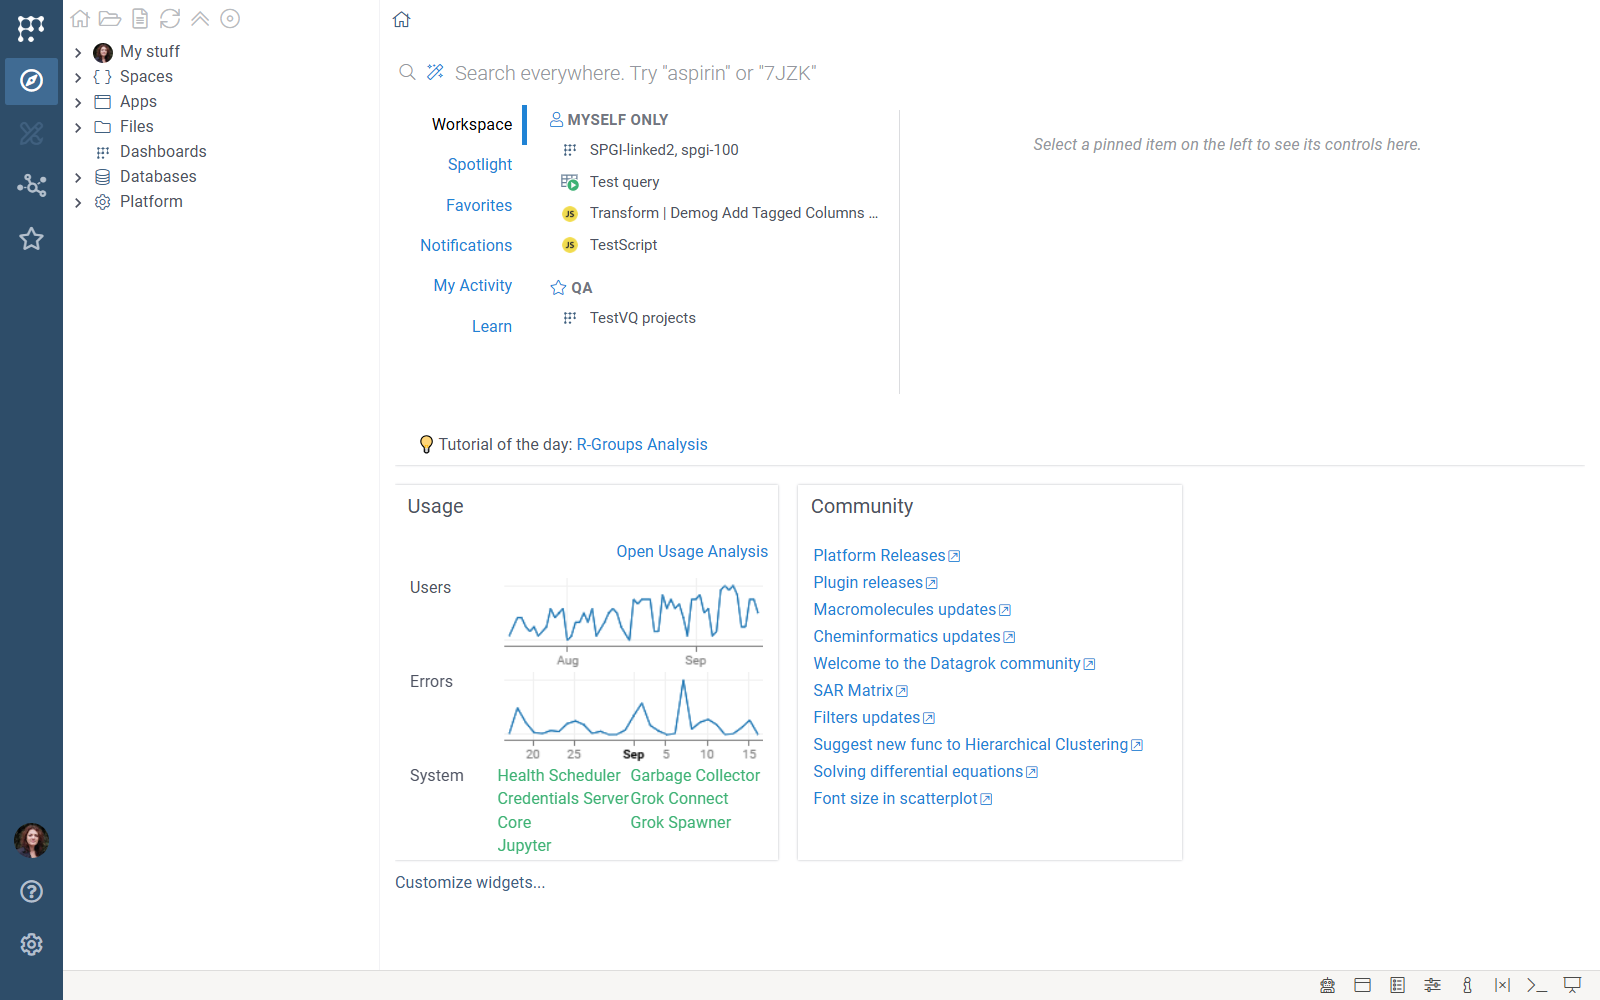
To choose which widgets the Home view shows, click the Customize widgets... link below them and toggle the widgets in the Context Panel. To hide a widget, hover over it and click the close (✕) icon in its top-right corner.
You can build custom widgets to show up on the Home page.
Importing text
To parse delimiter-separated text into a table, click the Open text icon at the top. Paste or edit your text, adjust the import parameters as needed, and click DONE to open the resulting table.