Dashboards
Datagrok stores both dashboards and spaces as projects. A space is a project that organizes other entities, like a folder. A dashboard is a project that holds data (one or more tables) together with the visualizations applied to it (a layout). Data and layout are separate entities, which lets a dashboard refresh its data without losing its visuals, lets you apply the same layout to a different dataset, and lets each user keep personal customizations without changing what others see.
This page covers the whole lifecycle of a dashboard: creating, saving, refreshing, sharing, changing, versioning, and retiring it. To learn how to connect to a database and write the queries that feed a dashboard, see Databases.
Creating a dashboard
To create a dashboard, follow these steps:
- Open a table to access the Table View. The table can come from a file, a database query, a script, or any other function.
- In the Table View, you can:
- Add viewers to visualize your data
- Transform data as needed
- Add filters
- Customize the grid, such as color-coding grid columns
- Optionally, add data from other tables. See Multiple tables.
- Save your dashboard.
Until you save, everything you do stays in your browser's memory. If you close or refresh the browser tab, unsaved work is lost.
You can also create projects programmatically. See the Project class in the JS API and the upload data how-to.
Multiple tables
A dashboard can hold several tables. Every open table is listed in the Tables panel (Alt + T) and in the Dashboards panel on the Sidebar (see Unsaved work), and each table has its own Table View. To bring them together, you can:
- Link tables, so that the current row, selection, or filter in one table drives the other. This is how master-detail and drill-down views work.
- Join tables into one when you need a single flat table to chart.
- Point a viewer at another table. A Table View belongs to one table, but any viewer in it can show a different open table: click the viewer's Gear icon and, in the Context Panel under Data, change Table. With Row Source set to Filtered or Selected, such a viewer shows only the rows that a link selects, which is how a chart of the details sits next to the master grid. See Viewers as filters.
- Show linked rows inside the grid instead of in a separate view.
- Fetch details on demand with the Database Explorer or data enrichment instead of loading them.
- Add several views of one table (right-click the table and select Add View), each with its own layout. All views of a table share the filter and selection.
For a live example of linked tables, open the Table Linking demo under Data Access in the demo app. For a step-by-step multi-table dashboard on the Northwind database, see the worked example on the Link tables page.
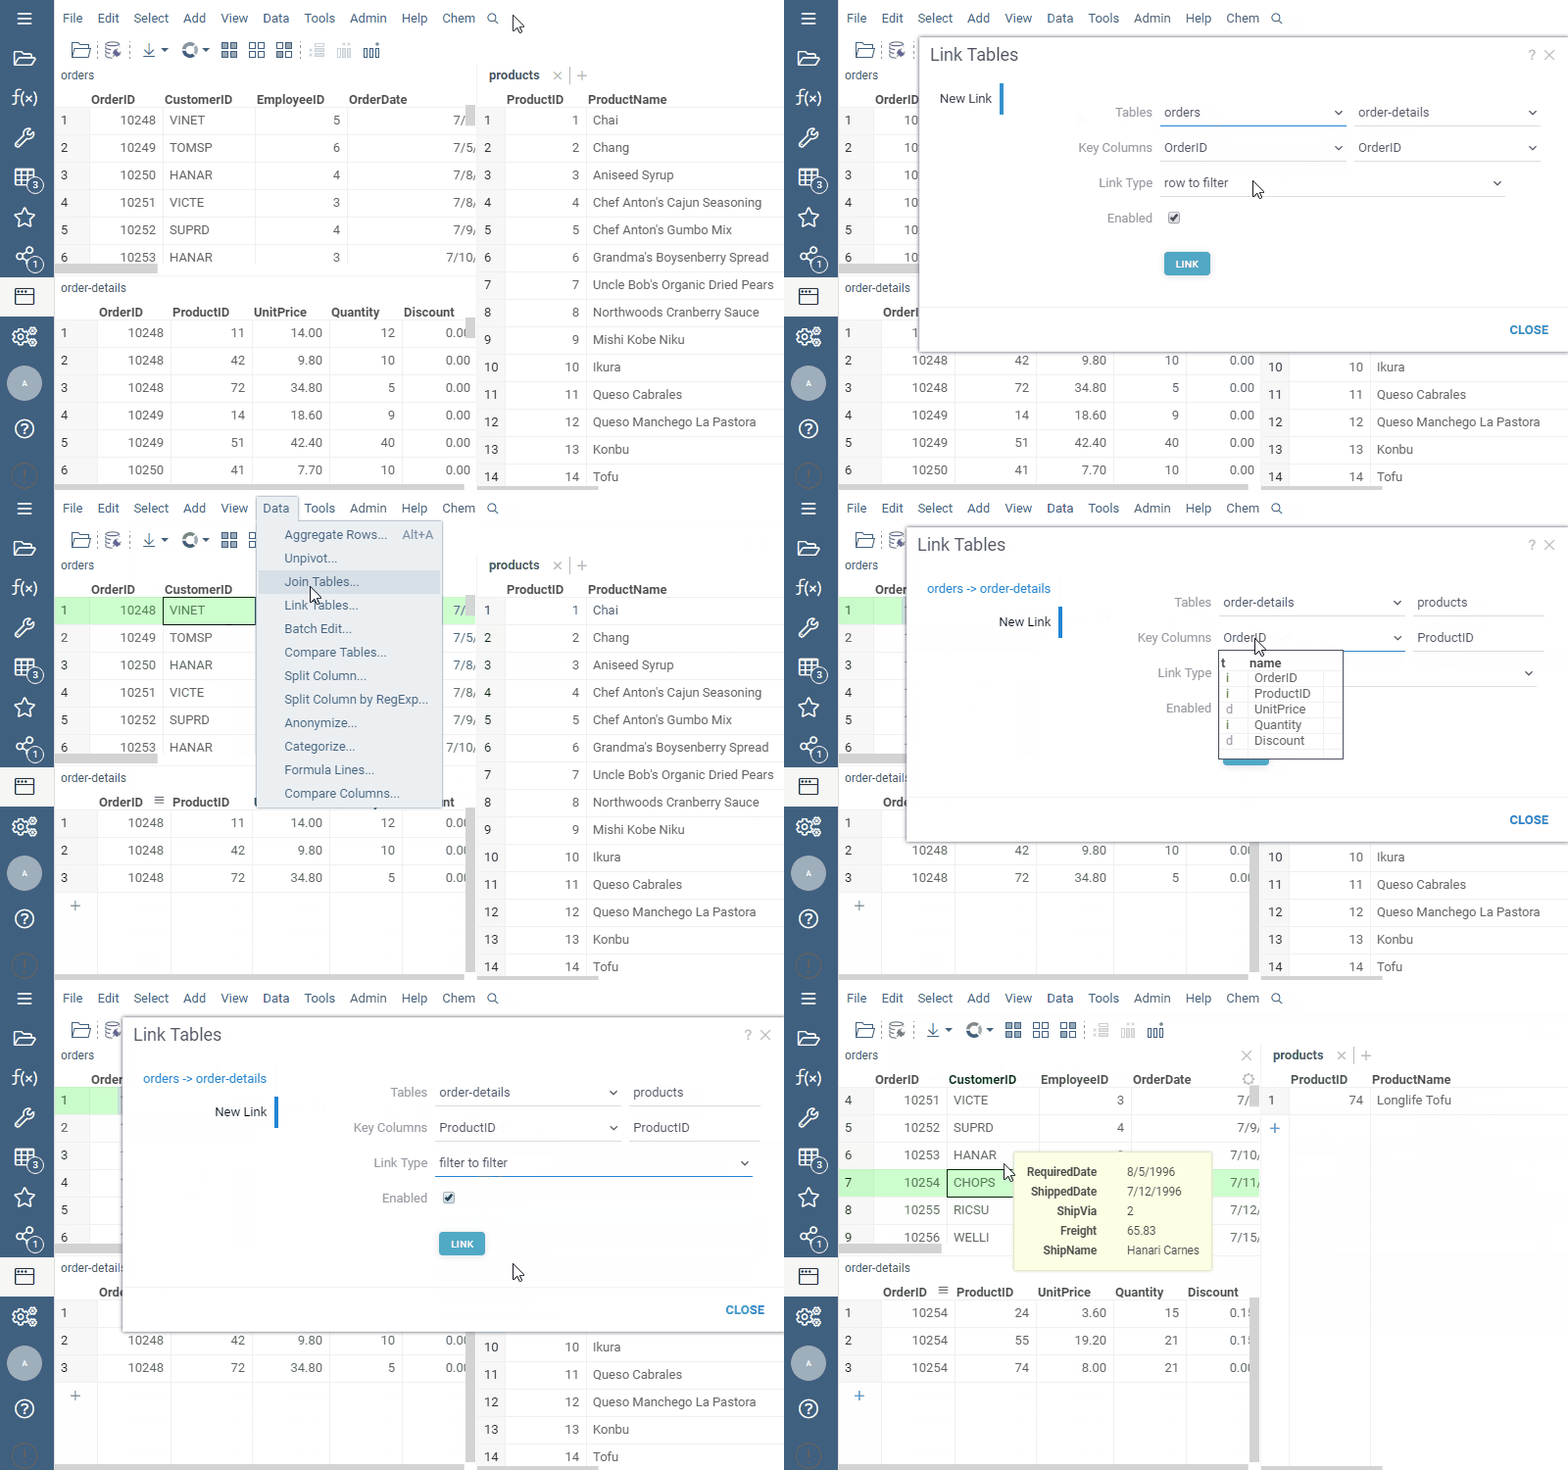
When you save, the Save project dialog lists all open tables. Links between tables and viewers that point at other tables are saved with the project. For a multi-table dashboard, keep these points in mind:
- Data sync is set per table. A live query table next to a static reference table is a common combination.
- Dependencies between tables are preserved. If one table is derived from another (for example, a join of two query results), Datagrok records the order in which they were produced and replays it. Static tables load first, and then the creation scripts run in the order they were recorded.
- Tables from other projects can be linked or cloned. A table you opened from another dashboard is saved either as a link (a read-only reference that follows the original) or as a clone (an independent copy). Recipients of your dashboard can read a linked table even if they can't see the project it comes from.
Saving a dashboard
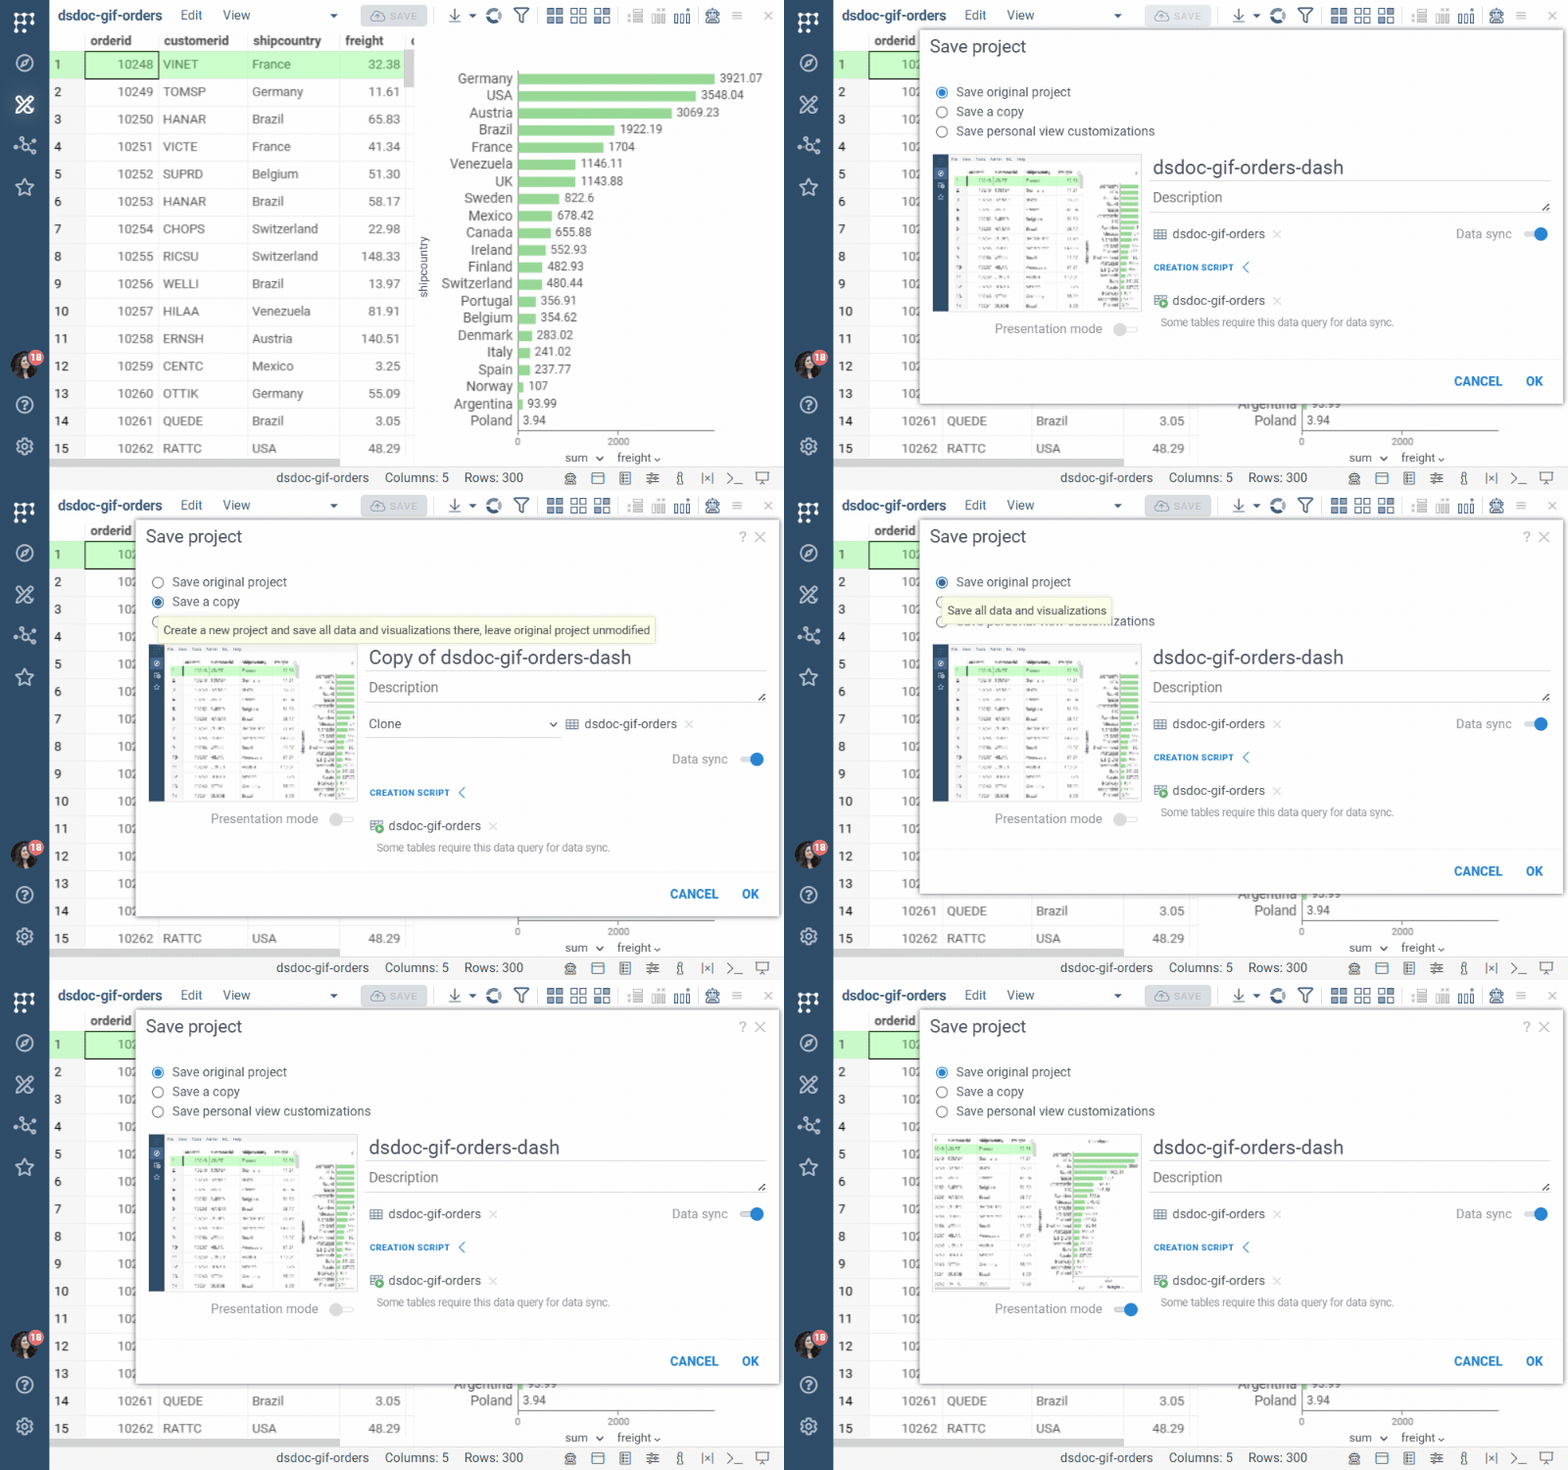
To save, click the SAVE button at the top of the screen. This opens the Save project dialog.
For a new dashboard, enter a name and, optionally, a description. New dashboards are saved to your personal space under My stuff in Browse. You can move them to a shared space later.
For an existing dashboard, the dialog lists all open tables. Remove the ones you don't want in the project, and then choose how to save:
- Save original project: Overwrites the project on the server. Choose it when you own the dashboard and want to publish the change to everyone.
- Save a copy: Creates a new project. For each table, you choose whether to Move it, Link it if the copy should keep showing the same data as the original, or, for a table that is already on the server, Clone it to make the copy independent. Choose this option when you want a variant, a "version", or when you don't have the privilege to edit the original.
- Save personal view customizations: Saves your layout changes for you only. The layout others see doesn't change. Choose it when you want a different arrangement of viewers without affecting the team.
Without the privilege to edit the dashboard, you can't save the original project, but you can still save a copy under your own name or keep personal view customizations that nobody else sees.
When you save the original project or a copy, the dialog offers two more settings:
- Data sync, set per table, decides where the data comes from when the dashboard opens. When it is on, the table's creation script runs again. When it is off, the dashboard shows the snapshot saved with it. New dashboards have Data sync on for every table that has a creation script, so turn it off for a table that should keep a snapshot. See Data sync.
- Presentation mode hides the sidebar, menus, ribbons, toolbox, and status bar when the dashboard opens. Use it for dashboards meant for data consumers rather than analysts. A viewer can switch back by clicking the Design mode link at the top right.
After a successful save, the SAVE button turns grey, indicating that there are no unsaved changes. You can still click it to open the dialog again, for example to save a copy or personal customizations.
Data sync
Tables created from queries, scripts, or files on a file share have a creation script that records how the table was created and what was done to it afterwards. You can see it in the Save project dialog under CREATION SCRIPT. With the edit privilege, you can view and edit the script in the Context Panel > Advanced > Creation scripts.
If a dashboard fails to open, Datagrok offers to edit its creation script so that the dashboard can be opened.
Data sync determines whether the creation script is run when the dashboard opens. When enabled, the dashboard stores the script and runs it each time, so the data can be refreshed from the source (a dynamic dashboard). When disabled, the dashboard stores the current data instead and does not need access to the source when opened (a static dashboard).
The only table that can't be saved with Data sync is one opened from a local file on your computer: Datagrok has no way to open that file again on its own. To sync such data, put the file on a file share and open it from there.
Static and dynamic dashboards compared
| Data sync off (static) | Data sync on (dynamic) | |
|---|---|---|
| What is stored | The data itself. The creation script is dropped | The creation script only. No data is uploaded |
| What happens on open | Opens immediately with the data as of the last save | Runs the creation script, then applies the layout to the fresh result |
| How current the data is | As old as the last save | Always current |
| Open time | Fast | Depends on the query and the database |
| Works if the source is unavailable | Yes | No. The dashboard stays on the loading spinner or fails to open |
| Parameters | Fixed at save time | Users can change query parameters under Toolbox > Source and refresh |
| What recipients need | Access to the dashboard | Access to the dashboard and to the database connection behind the query |
Because the switch is per table, one dashboard can combine both modes, for example a live query table joined to a static reference table.
Choose dynamic for operational dashboards that must show current data, and static for reports and for audiences that can't be given access to the source.
Sharing a dashboard
Saving a dashboard doesn't share it. A new dashboard is visible only to you until you share it explicitly.
To share a dashboard, right-click it in Browse and select Share... (you can also do this from the Context Panel). In the dialog, enter users, groups, or email addresses, choose the privilege, and click OK. For the general procedure, see Share.
Share with groups rather than with individual users where you can. When the team changes, you update the group instead of re-sharing every dashboard.
What recipients get
Sharing a dashboard gives recipients access to everything saved with it: the tables, the layout, and, for a dashboard saved with Data sync on, the queries and scripts used to load its tables, as well as the file connections they depend on. Recipients can re-run a query or script or re-read a file through the dashboard without separate permissions. These dependencies don't appear as separately shared entities in Browse.
Database connections work differently. The query is saved with the dashboard, but the database connection it uses is not. Recipients must have View and use permission on the connection to run the query. Demo and team connections are usually shared already. A private connection must be shared separately.
The simplest way to align these permissions is to put the dashboard and its sources in one space and share that instead. Privileges granted on a space cascade to everything in it, child spaces inherit them from the root, and new queries saved there are shared automatically. This is easier to maintain than sharing dashboards and connections one by one.
Sharing by link
Every dashboard has a URL. Anyone who already has permission to open the dashboard can use the URL, but the URL itself does not grant access.
For a dynamic dashboard based on a parameterized query, the URL also includes the current parameter values. Change the values in Toolbox > Source, then copy the updated URL to share that configuration. The recipient opens the same dashboard with those parameter values, so you can share different configurations without creating copies.
You can define custom URL parameters for a project and map them to the query's parameters.
Editing a dashboard
You can edit a dashboard in two ways: change its layout or the data behind it.
Editing the layout
Open the dashboard, rearrange or reconfigure the viewers, and click SAVE. Then choose:
- Save original project to publish the change to everyone
- Save personal view customizations to keep it to yourself
- Save a copy to leave the original untouched
If the layout is worth reusing on other datasets, also save it to the gallery (View > Layout > Save to Gallery). Layouts are independent entities, and a saved layout applies to any table whose columns match by name or semantic type. To learn more, see Layout.
When the source changes
Editing the query or script behind a dynamic dashboard changes what the dashboard shows the next time it opens. Renaming the query is safe, because Datagrok rewrites the creation script with the new name. Changing the query's output is where dashboards can break.
What happens when the query output changes
| Change in the source | Effect on the dashboard |
|---|---|
| A new column | Appears in the grid. Existing viewers are unaffected |
| A column renamed or removed | Viewers bound to it show a placeholder with the missing column name. The dashboard opens |
| A column removed that a calculated column uses | The dashboard opens with a warning, and the calculated column is empty |
| A column removed that a recorded step on the result uses, such as a deleted or renamed column | A Data loading error dialog lists the failed step. After Open anyway, the rest of the data loads |
| The query deleted | The dashboard fails to open with an error. A new query with the same name on the same connection repairs it |
| The column order changed | Cosmetic. The grid restores the saved column order by name |
Versioning
Datagrok doesn't keep a history of dashboard versions. Every Save original project overwrites the previous state, including changes that others saved in the meantime, without a warning (see also Local copy and server copy on the Browse page). The following practices serve as version control:
- Save a copy before a risky change. Click SAVE > Save a copy
before restructuring a dashboard the team depends on, and give the copy a
name that states its purpose, for example
Assay QC (2026-09 rework). Once the change is accepted, share the copy and retire the original. - Snapshot what must not change. For a report, a review package, or anything that has to be reproducible, save with Data sync off. The data is frozen together with the layout. A dynamic dashboard can't be reproduced later.
- Keep the layout in the gallery. View > Layout > Save to Gallery stores the layout as a separate entity, so you can reapply it after a bad edit or to a new dataset. View > Layout > Download stores it locally as a file.
- Record the state in the description. The project description is the place to note what changed and why. Recipients see it in Browse and in the share notification.
- Prefer copies over edits when you don't own the dashboard. Recipients with the View and use privilege can always save a copy and continue working without touching the original.
Retiring
To take a dashboard out of a space without destroying it, move it to another space, for example to your My stuff. Nothing stays behind in the original space. If the team should still see the dashboard there, use Link instead of Move.
To delete a dashboard, right-click it in Browse and select Delete Project.
Deleting removes the dashboard for all users and can't be undone. Tables and views owned by the dashboard are deleted with it. Linked tables and the queries the dashboard uses are not deleted, because they belong to other entities.
Before deleting, check whether other dashboards link to its tables. A linked table is marked with a link icon () in Browse.
Resources
YouTube videos:
Dynamic Dashboards
Building dynamic dashboards using database queries
See also: