Link tables
Linking connects two open tables through key columns without copying data. An action in one table (changing the current row, hovering, filtering, or selecting) updates the row state in the other table. Both tables remain separate.
Linking is useful for one-to-many relationships and master-detail browsing, where you want to explore related rows without combining the tables.
Joining or linking
Datagrok provides two ways to relate tables:
- Join combines matching rows into one wider table. A master row is repeated for each matching detail row. Use a join when you need one flat table for analysis or visualization.
- Link keeps the tables separate. The current row, selection, or filter in one table drives the other. Use a link when you want to browse related detail rows.
Creating a link
To link two tables, follow these steps:
- Open both tables.
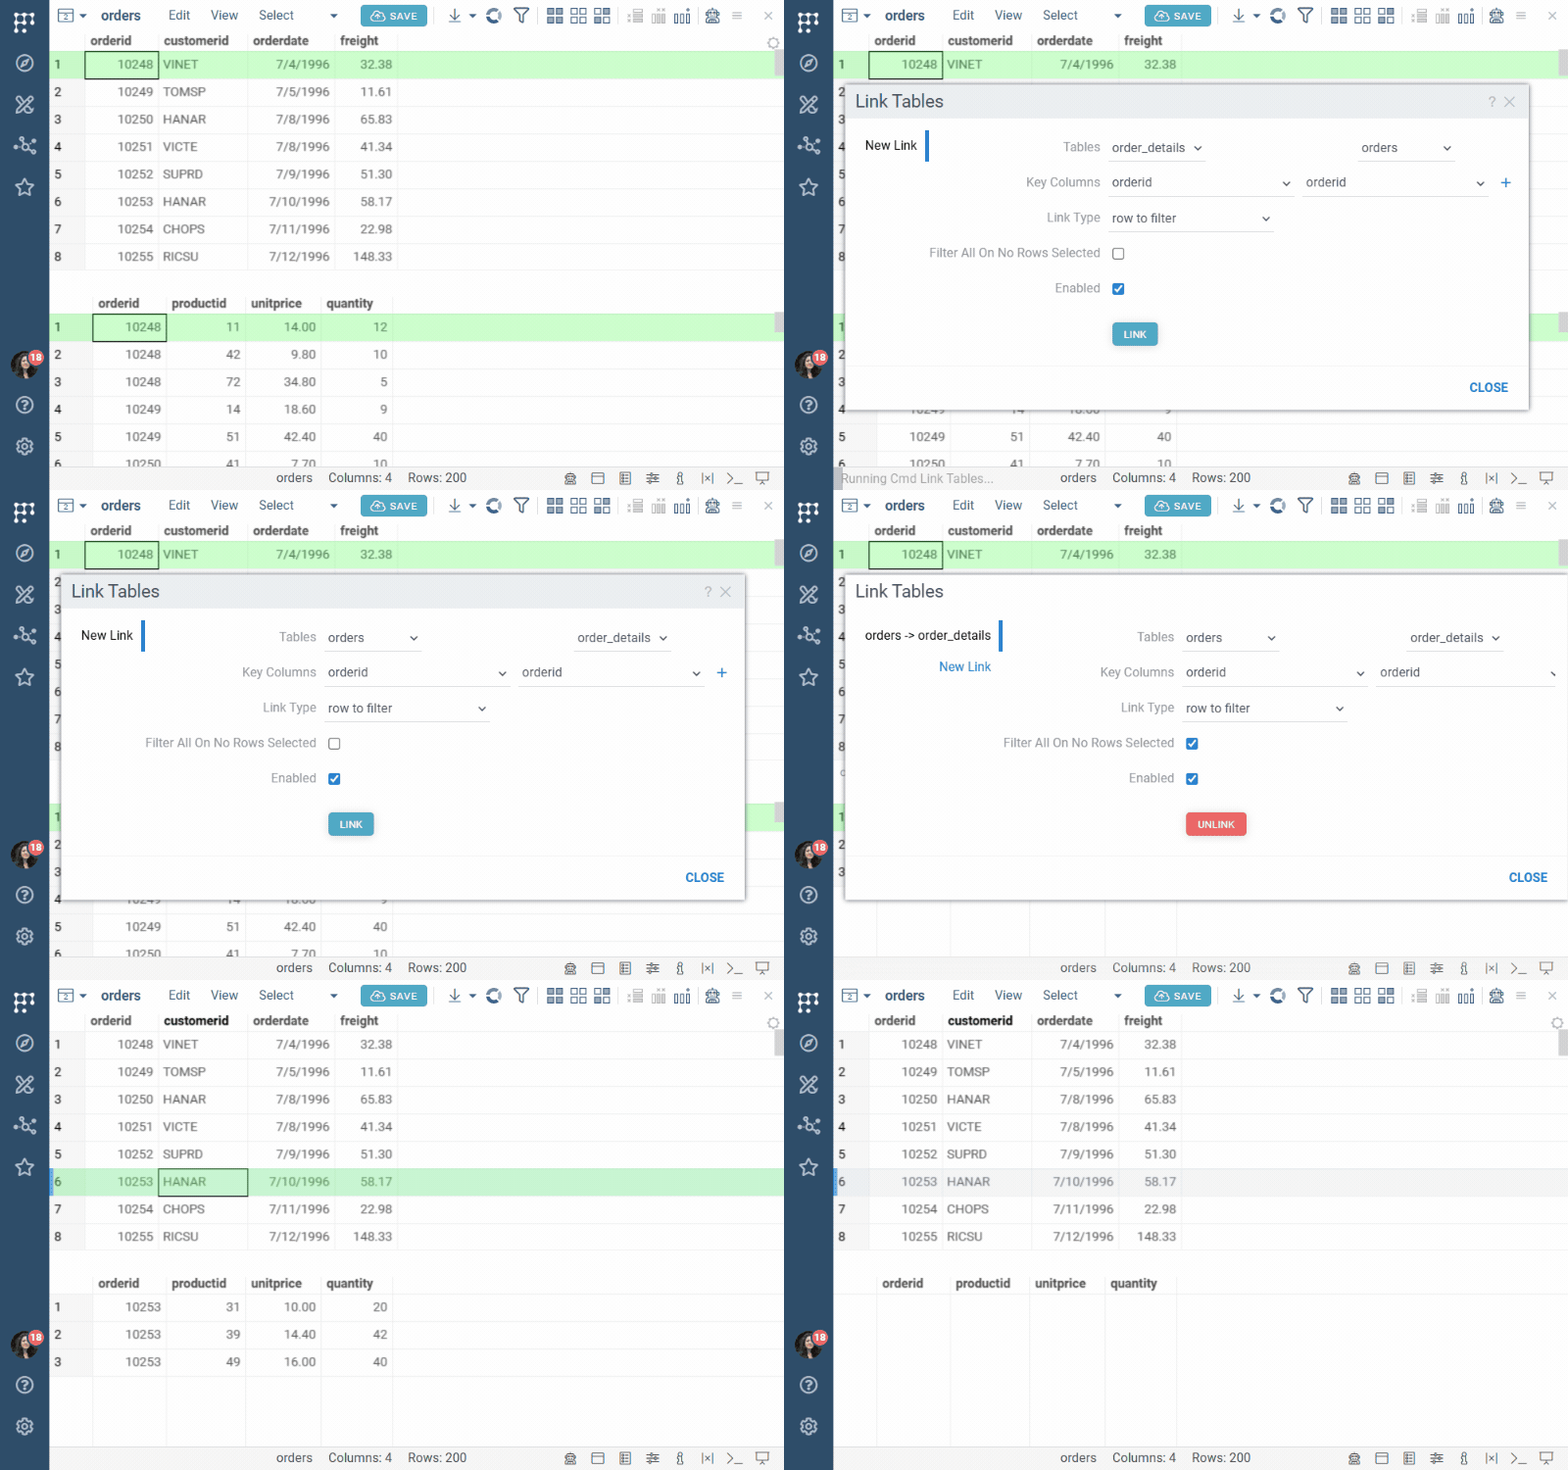
- On the Top Menu, select Data > Link Tables...
- In the dialog:
- Under Tables, choose the source table (the one you act on) and the target table (the one that responds).
- Under Key Columns, pick one or more pairs of key columns. Rows match when all key values are equal. Click + to add another pair for composite keys.
- In Link Type, choose what gets synchronized. See Link types.
- Click LINK. The new link gets its own tab in the dialog, next to New Link.
- On the link's tab, adjust the link if needed:
- Select Filter All On No Rows Selected for links that end in
filterif the target should show no rows while nothing is current, selected, or filtered in the source. This is useful for detail tables that should stay empty until a master row is chosen. - Clear Enabled to turn the link off temporarily and look at the whole target table without deleting it.
- Click UNLINK to remove the link.
- Select Filter All On No Rows Selected for links that end in
- Click CLOSE.
The same dialog lists the existing links, so you can come back to edit, disable, or remove them later.
Key columns are compared by value. Both columns should have the same data type and consistent formatting. A trailing space or a different case in one of them means no match.
Link types
A link type reads as <what changes in the source> to <what changes in the target>, where the source is the first table in the dialog.
| Link type | When you... in the source | The target... |
|---|---|---|
row to row | Change the current row | Moves its current row to the matching row |
row to selection | Change the current row | Selects all matching rows |
row to filter | Change the current row | Shows only the matching rows |
mouse-over to selection | Hover over a row | Selects all matching rows |
mouse-over to filter | Hover over a row | Shows only the matching rows |
filter to filter | Filter rows | Shows only the rows matching the filtered rows |
filter to selection | Filter rows | Selects the rows matching the filtered rows |
selection to filter | Select rows | Shows only the rows matching the selected rows |
selection to selection | Select rows | Selects the rows matching the selected rows |
The most common choices are:
row to filterfor master-detail browsing, for example to click an order and see its line items.selection to filterto compare several masters at once, for example to select five compounds and see all their measurements together.filter to filterto propagate the filter panel, for example to filter subjects by site and have their visits follow.row to selectionormouse-over to selectionto highlight without hiding. The target keeps all rows and highlights the matches.
Master-detail
A master-detail setup is a row to filter link, where the current row in the
master table filters the detail table. To set it up:
- Open both tables.
- On the Top Menu, select Data > Link Tables...
- Pick the master table as the source, the detail table as the target, the
key columns, and the link type
row to filter, and click LINK. - Optionally, on the new link's tab, select Filter All On No Rows Selected so that the detail table shows nothing until a master row is chosen. Then click CLOSE.
Now clicking a row in the master grid filters the detail grid to the matching rows. You can put both grids side by side, or add a viewer on the detail table to the master view with Row Source set to Filtered. To learn more about the Row Source and On Click settings, see Viewers as filters.
Drilling down
Linking is also how you drill down from a summary to the rows behind it:
- From an aggregate to its rows. Summarize the table with
Aggregate rows (for example, count and average per
compound), and then link the aggregated table to the original one on the
grouping columns with
row to filter. Clicking a summary row now shows the measurements it was computed from. A pivoted table works the same way. - From a chart segment to its rows. Any bar chart or pie chart can act as the drill-down control: set On Click to Filter on the viewer, and clicking a bar filters the table to that category. See Viewers as filters.
- From an identifier to related records. When the Database Explorer is configured for your database, clicking an identifier such as a compound or batch ID anywhere in Datagrok shows the record in the Context Panel, together with everything related to it through foreign keys. No detail table is loaded and no query is written.
- From a row into a parameterized query. A query with an input such as
compoundId, run from the Context Panel for the current row, returns that row's details from the database. See Parameterized queries.
Cascading links
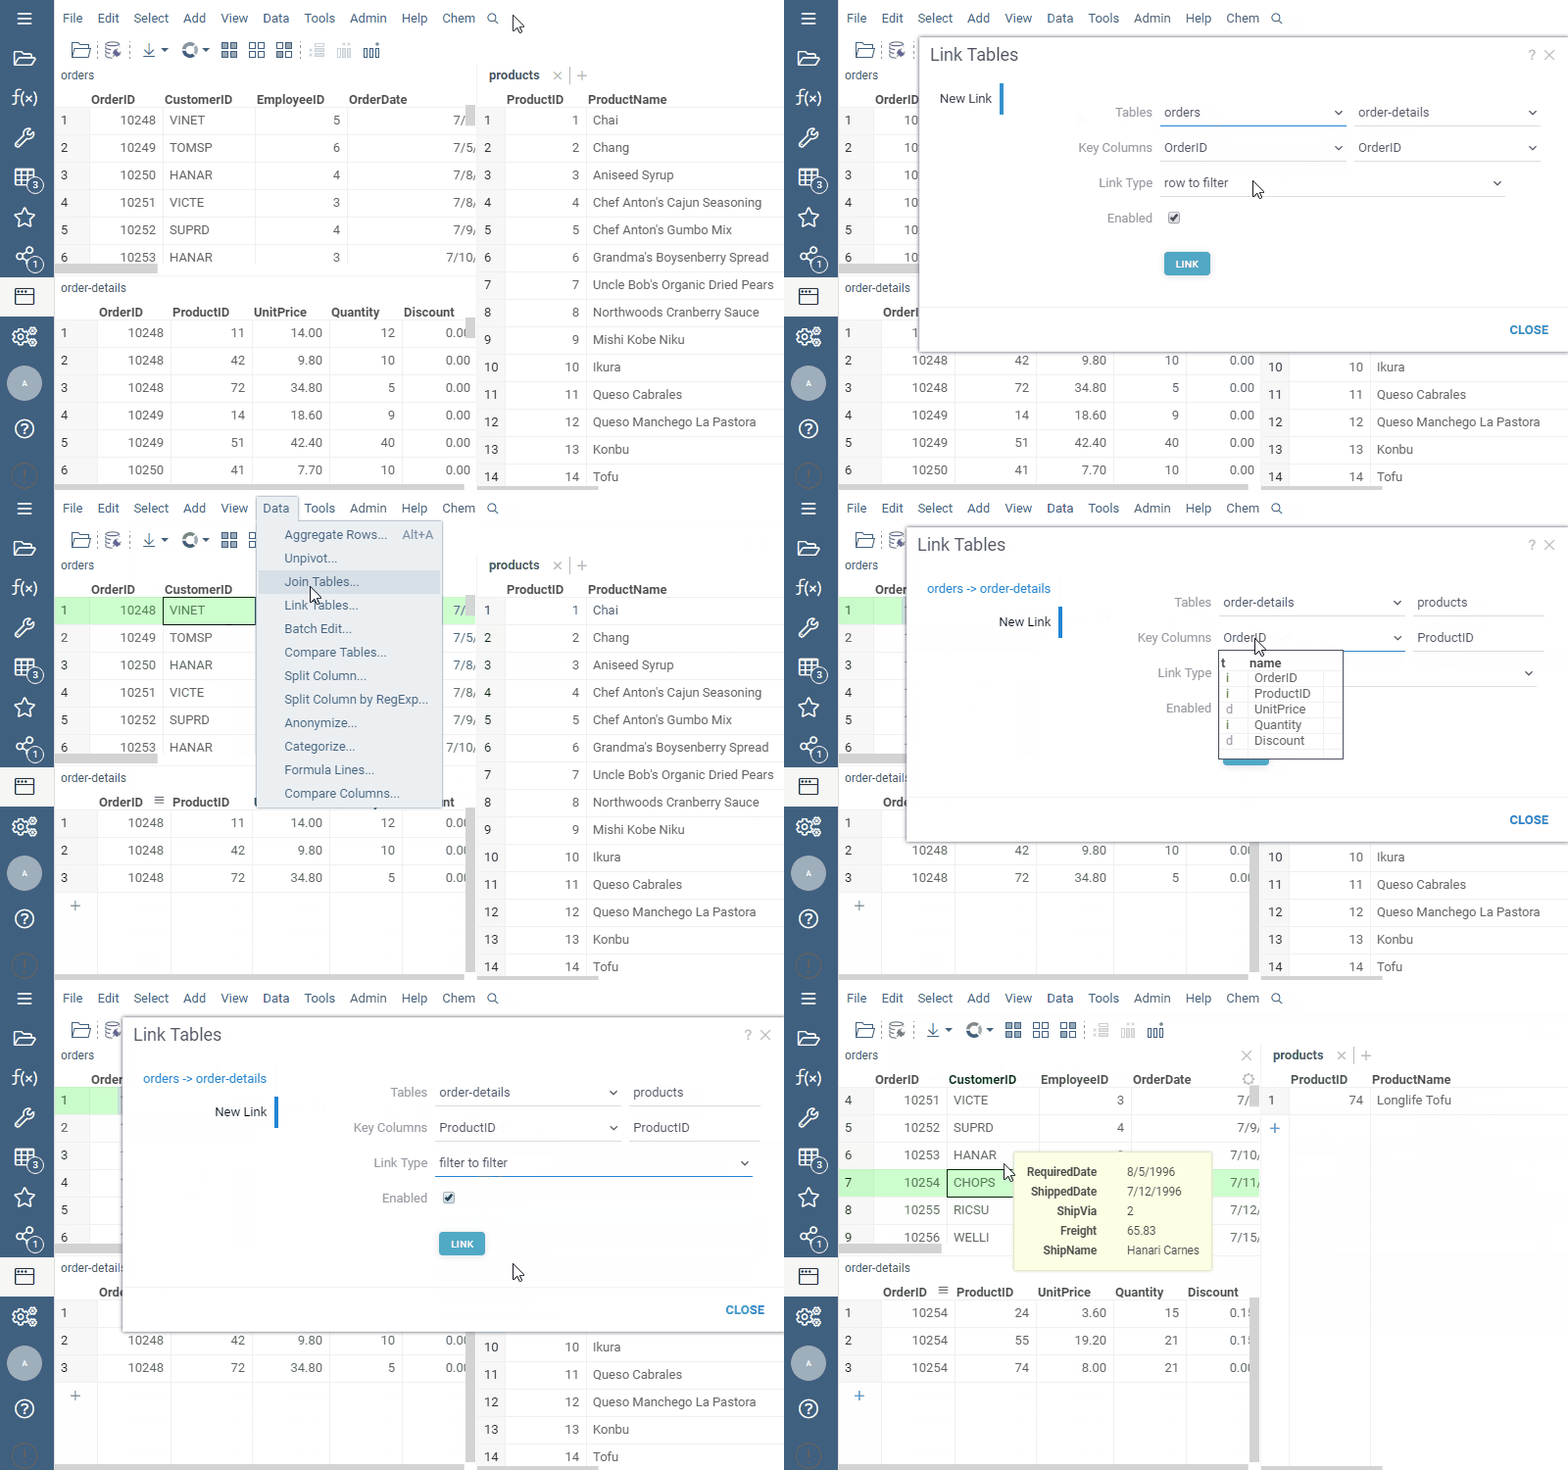
Links can be chained. When the target of one link is the source of another, a change in the first table propagates through all of them. For example, with three Northwind tables:
orderstoorder_detailsonorderid, usingrow to filterorder_detailstoproductsonproductid, usingfilter to filter
Clicking an order filters its details, and the filtered details in turn filter the products table to the products in that order.
Worked example: a master-detail dashboard on the Northwind demo database
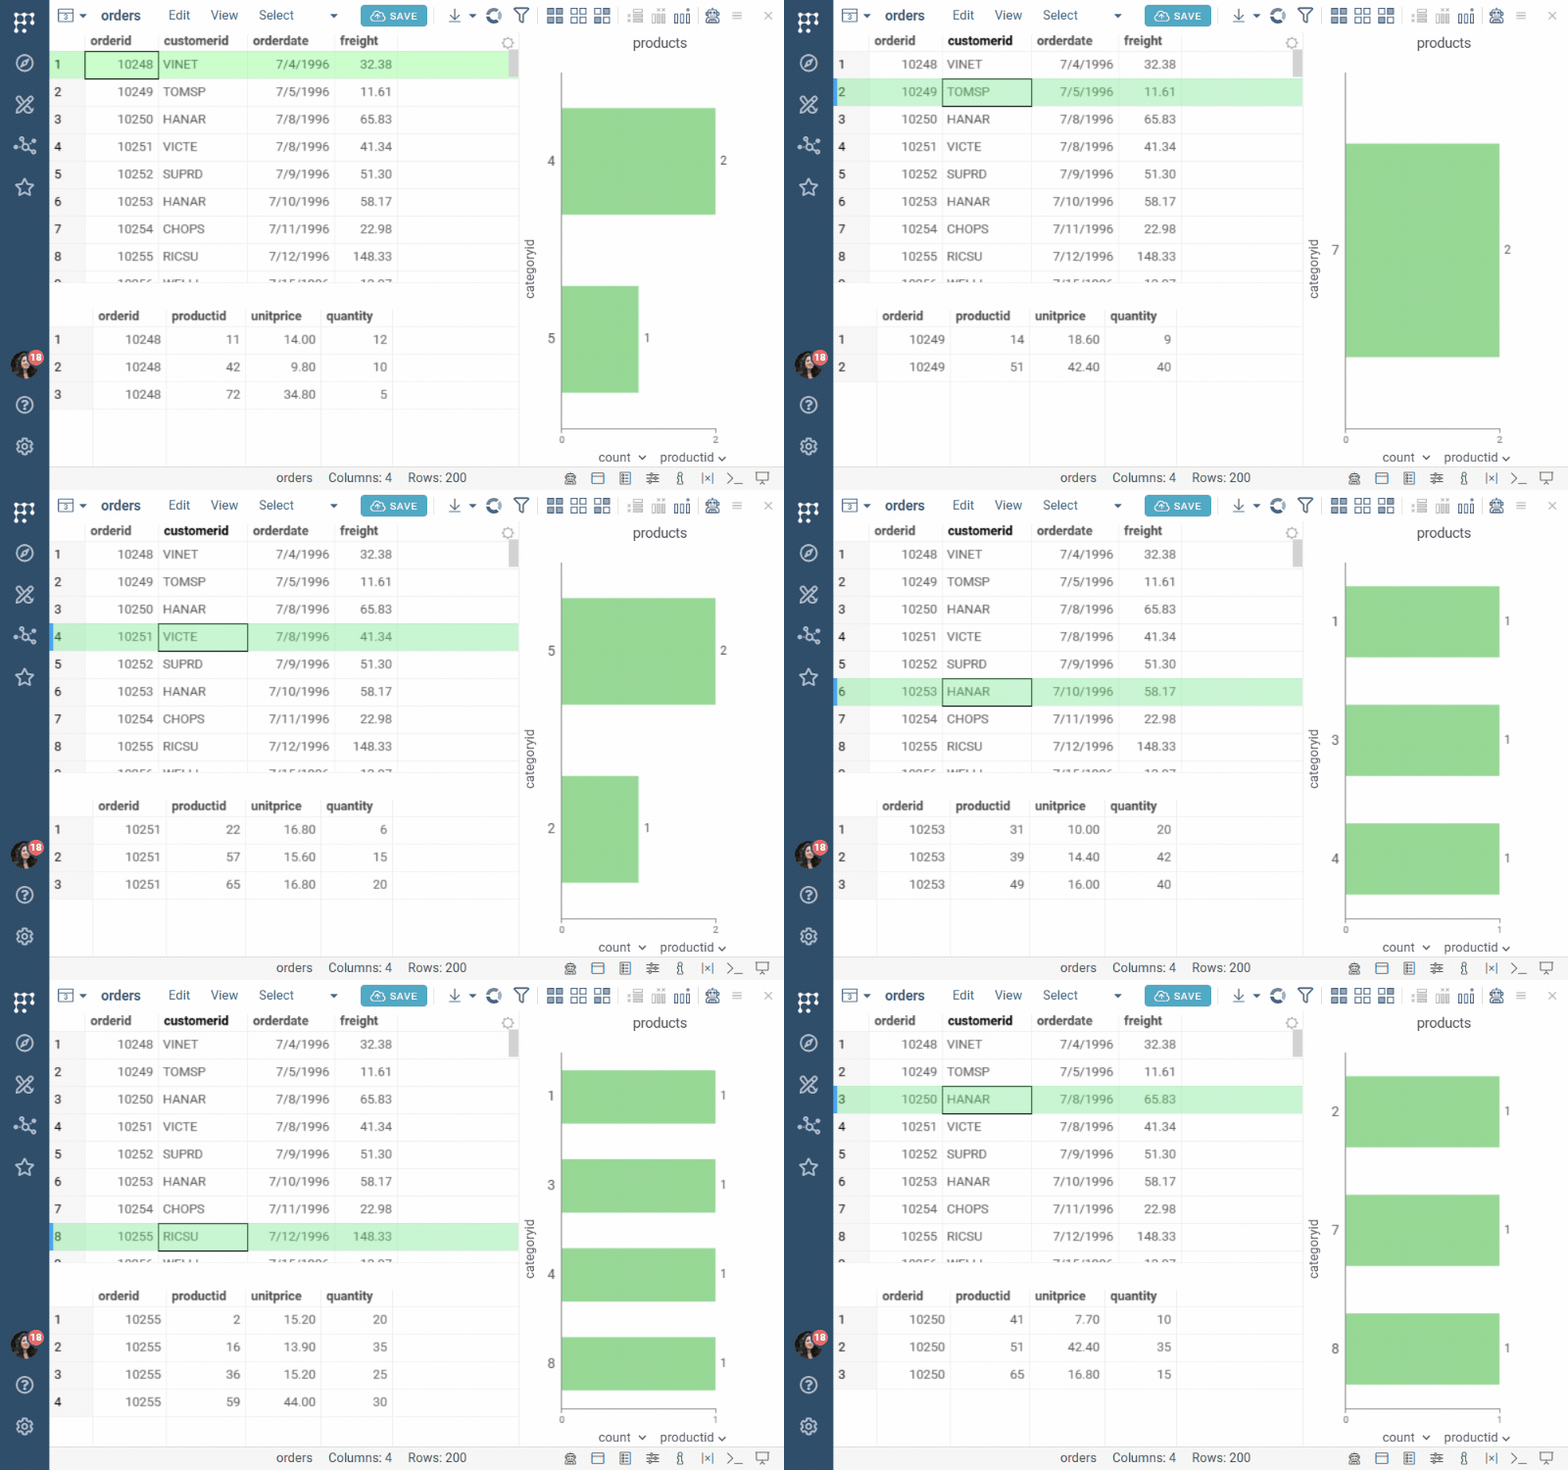
This example builds a master-detail dashboard on the Northwind demo database: you pick an order and see its line items and the products in it. Northwind ships as a demo connection named Northwind under its database type in Browse > Databases.
- Open three tables. Expand the Northwind connection, right-click
orders,order_details, andproductsin turn, and select Get All. Each table opens in its own Table View. - Link
orderstoorder_details. On the Top Menu, select Data > Link Tables..., chooseordersandorder_details, set the key columns toorderidon both sides and the link type torow to filter, and click LINK. On the new link's tab, select Filter All On No Rows Selected. - Link
order_detailstoproductsin the same way, withproductidas the key andfilter to filteras the link type. Click CLOSE. - Show the details next to the orders. Go to the
ordersview, add a grid, click its Gear icon, and under Data set Table toorder_detailsand Row Source to Filtered. Dock it below the orders grid. - Add a chart on products. In the same view, add a
bar chart, set its Table to
productsand Row Source to Filtered, and split it bycategoryid. - Click an order. The details grid shows its line items, and the bar chart shows the categories of the products in it.
- Click SAVE. Keep Data sync on for all three tables, so that the dashboard re-runs the three queries on every open, and share the dashboard and the Northwind connection with your team. See What recipients get.
For a smaller live example that needs no database, open the Table Linking demo under Data Access in the demo app.
Links and viewers
Linking changes the row state (current, selected, or filtered) of the target table, and every viewer on the target table reacts the same way it reacts to a manual filter or selection. Set a viewer's Row Source to Filtered or Selected so that it shows only the linked rows.
A viewer can also show a table other than the one its view belongs to. Click the viewer's Gear icon and change Table under Data in the Context Panel. This is how one view shows a master table next to a chart of its linked details.
To show the matching target rows inside the source grid instead of in a separate view, right-click a cell, select Add > Linked Tables, and choose the target table. See Data from linked tables.
Links in projects
Links are saved with the dashboard and re-established when it opens. If a linked table is dynamic (Data sync on) and its key column is renamed in the source query, the link stops matching, so keep key column names stable. For what else to check when saving a dashboard with several tables, see Multiple tables.
To link tables from a script or a plugin, see the Linking tables sample.
See also: